
Hosted Monitoring For Managed Service and Cloud Providers.
No configuration. No hardware to manage.
No long-term commitment. Deploys in minutes.
© 2008 - 2014 LogicMonitor Inc. All rights reserved.
Call us at 888-415-6442

LogicMonitor will watch over everything critical in your customer's environment and proactively alerts you to any issues to make you and your team more efficient.
Hosted Monitoring For MSP's and CSP's: see what's causing your customer's performance issues whether it is their network, server, applications or storage. Complete picture of their entire infrastructure and health of their systems, making it easy to pinpoint the cause and resolve their issue faster.
Right-Size Your Cloud: Know what’s going on in your data center so you can ensure availability,
and make more informed decisions about capacity.Make UpSelling Easier: Arm your sales reps with easy-to-read graphs that visually demonstrate
to customers the need to add capacity.One Standardized Tool: Whether you’re monitoring firewalls, switches, routers, Windows
or Linux servers, VMware, Xenserver, Exchange, databases, SANs…you have all your alerting,
trending and reporting in one place.- Organized View of All Customers: Keep tabs on the health of all your customer’s critical infrastructure from one dashboard. Quickly identify which customer’s need attention.
![]()
![]()
You'll get alerts to issues before they impact your business.
Alert Delivery Methods
E-mail, SMS text message, Phone call (via text to speech), Webhooks,
or viewable in application.
Alert Escalation
If specified recipients don’t acknowledge an alert within a given time
period, alerts can be escalated to the next level in an escalation chain.
Alert Routing
Easily route alerts to different people and set escalation rules based on type of device,
severity of issue, or even time of day.
Alert Management
Manage alerts globally, on a group level, host level or at the individual object.
Acknowledge alerts, escalate, or even schedule downtime – directly from your
email, web or phone.
![]()
![]()
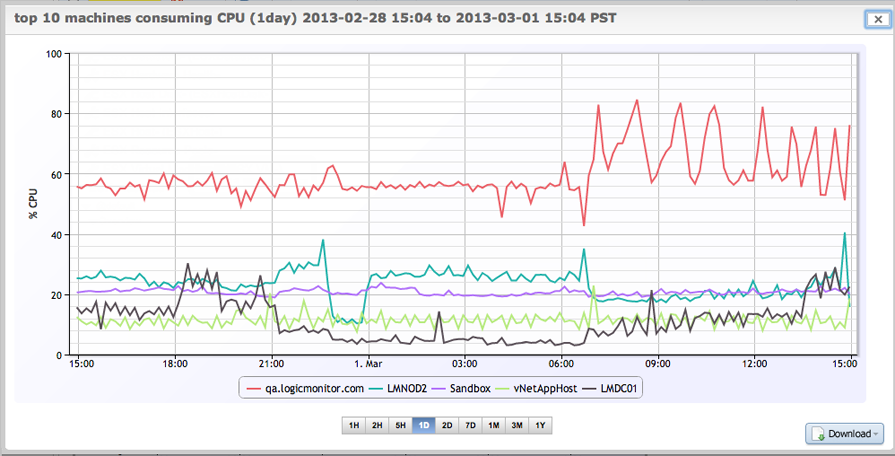
See what's going on immediately, with trending graphs.
-
No more guessing about performance and utilization
-
Interactive graphs show you exactly what’s going on so you can quickly diagnose and resolve performance issues
-
Zoom in or out to any time frame, from as far back as 1 year to as recent as 10 minutes ago
-
Historical trending data helps you improve capacity planning, and make more informed purchase decisions
![]()
![]()
Dashboards that show your most important metrics on one screen.
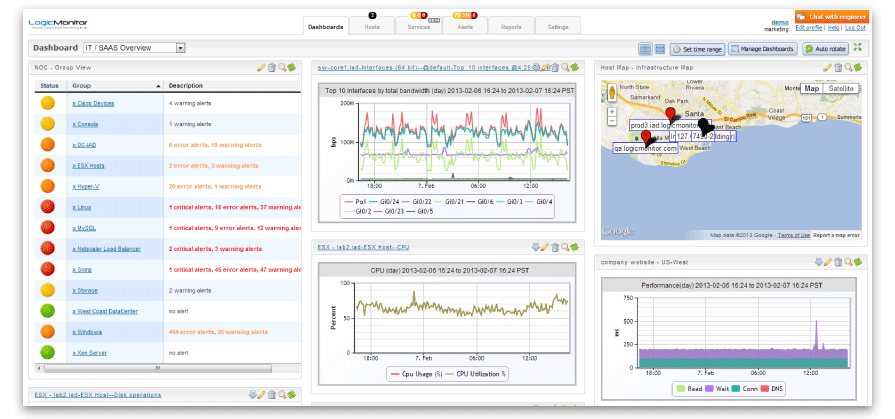
- Performance graphs for individual hosts
- Custom graphs that aggregate data from multiple hosts
- Top 10 Overview Graphs
- Colored alert indicator for at-a-glance health status of host groups
- Real-time business metrics
![]()
![]()
There is no costly infrastructure to manage.
-
LogicMonitor is delivered via Software as a Service
-
No CAPEX costs
-
We are responsible for all the monitoring infrastructure costs
(servers, networking equipment, storage, power) -
No upfront costs - just pay monthly by the devices you monitor
-
No systems to maintain
-
Free upgrades
-
Month-to-month - cancel if your needs change.
![]()
![]()
Configuration is quick and painless.
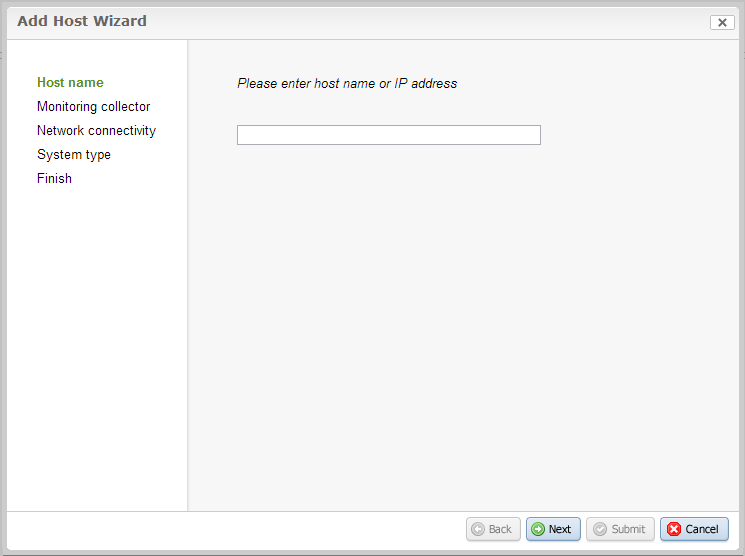
Just enter an IP address and LogicMonitor figures out what the device is, and automatically starts monitoring hardware, resouces, services, and applications according to best practices.
![]()
![]()
So you can worry less and get more done.

Jump to: Hosted Monitoring Get alerts Trending graphs Dashboards Cloud convenience Configuration Worry less Free trial
Provide Better Service And Make Your Staff More Efficient
You can’t provide expert service if you don’t have visibility into your customer’s critical infrastructure. LogicMonitor gives your staff the intelligence they need to be more proactive, and provide more trustworthy advice. Data presented in a format that allows engineers to easily spot anomalies and resolve issues faster, which reduces labor costs.


We respect your privacy and will not share your information with any third party.