Why use LogicMonitor?
People value LogicMonitor for many of the same reasons as Puppet. It helps you scale efficiently and reliably. With less human error. And greater piece of mind.
When you push out a new machine through Puppet, you have assurance that all of its components and services are properly monitored, placed in the right host groups within LogicMonitor, with the right properties. All automatically. No more time-consuming manual monitoring configuration.
Watch a short overview video
What can you monitor with LogicMonitor?

LogicMonitor's pre-configured monitoring templates give you instant monitoring, alerting, and trending for all your applications and underlying infrastructure including:
- Hypervisors (VMware, Citrix, Microsoft Hyper-V)
- Servers via SNMP (UNIX, Linux, Windows)
- Servers via WMI (Windows Server systems)
- Routers (Cisco, Juniper, etc.)
- Switches (Cisco, Juniper, Arista, etc.)
- Firewalls (Cisco, Juniper, NetScreen, SonicWALL, Fortinet, etc.)
- Storage Systems (NetApp, HP, Dell, EMC, etc.)
- Load balancers (F5, NetScaler, Kemp, etc.)
- Databases (SQL Server, MySQL, Oracle, MongoDB, etc.)
- Server Applications (Apache, IIS, NGNX, Exchange, Java, Tomcat)
- And more, all from one application
How does it work?
One Collector Monitors All
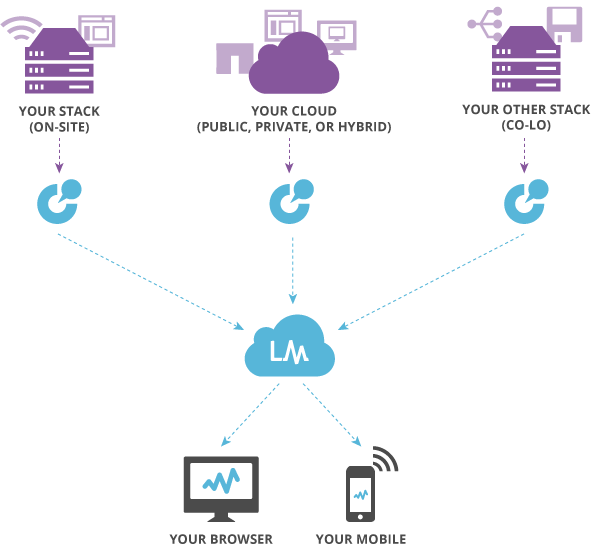
Simply install a lightweight collector on any Windows or Linux machine inside your firewall, point it at the devices you want to monitor, and get instant monitoring, alerting, and trending. No configuration required.

Flexible data collection methods
LogicMonitor can collect data using a variety of protocols including:
- SNMP
- WMI
- Perfmon
- JDBC
- JMX
- IPMI
- Web page parsing
- log parsing
- custom scripts
- and various vendor specific APIs (Netapp, VMware, Citrix Xen, Amazon EC2, etc)
In addition, LogicMonitor can query your custom applications, store the data, graph it, and alert on it, giving you real-time business intelligence.
Email, SMS, and Phone Call Alerts
If thresholds are exceeded, LogicMonitor sends alerts via email, SMS or phone call. Alerts come from our data centers, so even if your system goes down, you’ll still receive alerts.
Check System Health from Anywhere
View role-based dashboards, performance graphs, and alerts from any browser or phone.
No single point of failure
With on-premise monitoring systems, if there's a power outage, a broken network link, or some other issue affecting your infrastructure, your monitoring will not function at the very time it's needed to assess the situation and restore operations. With LogicMonitor being cloud-based and run in geographically distributed data centers, your alerting remains intact, preventing issues from going unnoticed for extended periods.
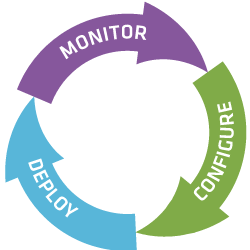
Automate your monitoring. Monitor your automation.
 "Both LogicMonitor and Puppet are critical to our operations. Without them we could not do what we do. As an Ops guy I don’t want to work anywhere that doesn’t deploy these tools.”
- Josh Cody
Senior Operations Engineer, Cedexis

- No dedicated server to setup/manage
- No time-consuming configuration
- Be up and running and seeing meaningful data in minutes
- No credit card required
*For free hoodie, must start trial before 9/30/2013, and add at least 1 device into your free trial account. Hoodie offer only available in U.S.A.

